In my previous installment of crocheting & plotting, I used ggplot2 to make a scatterplot depicting crochet circles, only to discover that actual crochet circles (made with a crochet hook and yarn using the traditional increasing pattern) produce a shape closer to a hexagon.
To be clear, this distinction doesn’t usually make much of a difference in crocheted items. For example, in this exercise I am making the base of a yoga mat bag. Once I finish making the “circle”, I’m just going to crochet a long tube on top of it by working a single crochet stitch in each stitch around until it’s big enough for a yoga mat. The tube won’t be shaped like a hexagon unless I find a yoga mat that folds up into a hexagon to put in it.
For one time only I’m going to crochet an actual circle that does not resemble a hexagon.
Then I’m going to make a scatterplot representing crochet stitches in a spiral hexagon pattern, since that’s what I normally make.
Getting started
Alright, let’s begin by including the ggplot2 package for the visualizations and the dplyr package for manipulating data.
library(ggplot2)
library(dplyr)
Here is a theme for the scatterplots.
crochet_theme <- theme(panel.grid = element_blank(),
                       panel.background = element_rect(fill = "#cccccc"),
                       axis.text = element_blank(),
                       axis.ticks = element_blank(),
                       axis.title = element_blank(),
                       legend.position = "none")
Writing a crochet pattern as code
I am definitely not the first person to make this observation, but crochet (and of course knit) patterns are a lot like programming. They employ many loops (haha loops, get it?) and if statements. If I were to write the crochet circle pattern as R code, it might look something like this:
crochet_circle <- function(stitches = 6, rounds = 12) {
   #round 1: single crochet {stitches} times in a magic ring
   for(i in 1:stitches) {
     single_crochet()
   }
   #round 2 on: sc and increase
   round <- 2
   nstitches <- stitches
   while(round <= rounds) {
     #nstitches is the number of stitches in previous round
     #(you always crochet into the previous round/row)
     for(j in 1:nstitches) {
       #increase every {round - 1} stitches, sc otherwise
       if(j %% (round-1) == 0) {
         increase()
       }
       else {
         single_crochet()
       }
     }
     nstitches <- stitches * round
     round <- round + 1
   }
 }
Assumptions for the crochet_circle() fake function:
The
single_crochet()function performs one single crochet in the current stitchThe
increase()function performs two single crochets in the current stitch
The circle starts in the center and works its way out. I start with 6 beginning stitches for a circle. Whatever number of stitches we start with is the number of increases we do on each subsequent round.
In each round starting with round 2, we work our single crochet (sc) stitches into the previous round. So in round 2, we increase() in each stitch to go from 6 to 12 total stitches. In round 3, we increase() in every second stitch to go from 12 to 18 total stitches.
And so on until we get to the total number of rounds, in this case 12. In the final round of this pattern, we increase() in every eleventh stitch.
So that’s the pattern that produces a hexagon-looking spiral. It emerges as a hexagon because I increase in the same 6 places in each round.
Crocheting an actual circle
I bought multi-colored yarn because I thought it might make it easier to see the round progression. I don’t think it does, but the yarn is fun anyway.
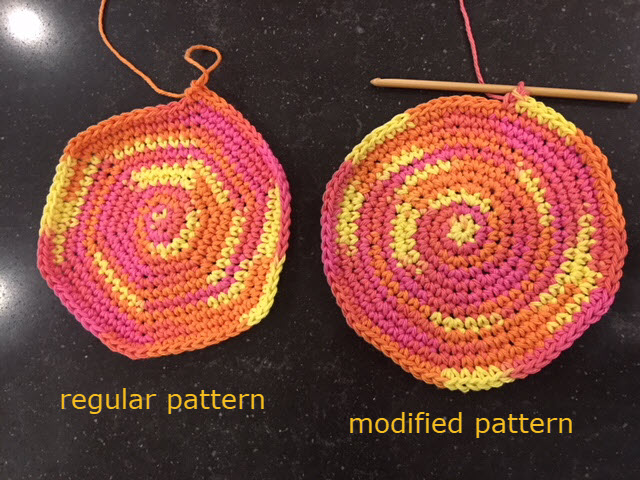
The one on the left is made how I usually make circles which is why it looks like a hexagon. I modified the pattern to make the one on the right, causing it to look much closer to a circle. To make it more of a circle, I had to move the increase() around so it was in the middle of the single_crochet() stitches, as opposed to always putting it after them.
Doing this made crocheting less fun for me. Maybe it’s because I’m set in my ways, but it was harder to mentally keep track of where I was putting the increases. I actually somehow ended up with two extra stitches, which explains why the circle is bigger than the hexagon in the picture! (Another reason: I’m not very good at taking pictures.)
Alright, now that I know I can crochet an actual circle, it’s time to use ggplot2 to plot a hexagon in the round, showing what my usual circles really look like.
Making hexagons
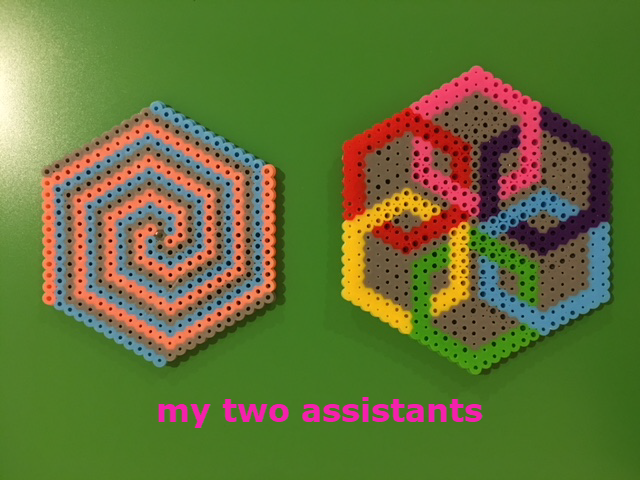
I used making hexagons very literally here and created some hexagons out of perler beads, bringing yet another of my passions into this project. Though I must say, having and creating physical hexagons out of yarn and perler beads really did help me write my hexagon algorithm. So did studying hexagon properties on wikipedia.
After a lot of hexagon spinning, I wrote this function to calculate the coordinates of a spiral hexagon:
hex_points0 <- function(rounds, distance = 0.5) {
  sides <- 6
  t <- distance
  r <- t * (sqrt(3) / 2)
  x <- c(0)
  y <- c(0)
  for(i in 1:rounds) {
    for(j in 1:sides) {
      xx <- c(0, r, r, 0, -(r), -(r), 0)
      yy <- c(t, (t / 2), -(t / 2), -(t), -(t / 2), (t / 2), t)
      newx <- seq(xx[j], xx[j+1], length.out = i+1)
      newy <- seq(yy[j], yy[j+1], length.out = i+1)
      x <- c(x, newx[-1])
      y <- c(y, newy[-1])
      t <- t + distance / sides
      r <- t * (sqrt(3) / 2)
    }
  }
  return(data.frame(cbind(x, y)))
}
It recalculates the hexagon points 6 times for each round. For comparison, a circular spiral function with evenly spaced points recalculates reference points for each set of (x,y) coordinates. And a function that made nested hexagons (i.e not spiral or in the round) would recalculate the hexagon points only once per round.
Here’s a plot of the x and y coordinates produced by this function:
hexXY <- hex_points0(12)

ggplot(hexXY, aes(x = x, y = y)) +
  geom_point(size = 5, shape = 19, color = "#ff33cc") +
  crochet_theme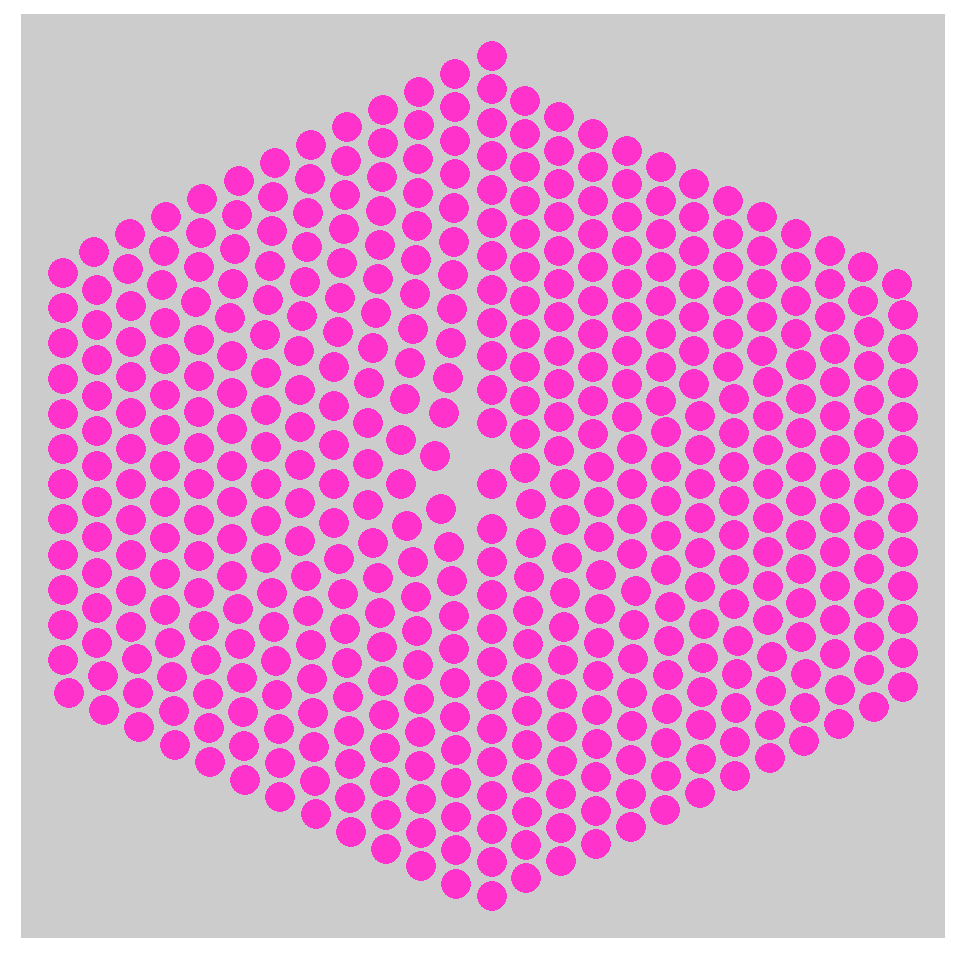
That’s what I was looking for: a spiral hexagon. But it would be nice to be able to see exactly where the points are being increased, and where the rounds begin and end more easily. So I added to the hex_points0() function so it gives us the round and position number of each point, in addition to the x and y cooridnates. This should help us visualize the spiral hexagon in a more useful way.
Expanding the hexagon function
hex_points1 <- function(rounds, distance = 0.5) {
  sides <- 6
  t <- distance
  r <- t * (sqrt(3) / 2)
  x <- c(0)
  y <- c(0)
  rnd <- c(0)
  pos <- c(0)
  for(i in 1:rounds) {
    rnd <- c(rnd, rep(i, i*sides))
    pos <- c(pos, 1:(i*sides))
    for(j in 1:sides) {
      xx <- c(0, r, r, 0, -(r), -(r), 0)
      yy <- c(t, (t / 2), -(t / 2), -(t), -(t / 2), (t / 2), t)
      newx <- seq(xx[j], xx[j+1], length.out = i+1)
      newy <- seq(yy[j], yy[j+1], length.out = i+1)
      x <- c(x, newx[-1])
      y <- c(y, newy[-1])
      t <- t + distance / sides
      r <- t * (sqrt(3) / 2)
    }
  }
  stitch <- 0:(length(x)-1)
  return(data.frame(cbind(stitch, x, y, rnd, pos)))
}
The new variables rnd, pos, and stitch will keep track of the round and position values for each (x, y) coordinate, and help us determine the points that are the increases. Here we use the dplyr mutate() function to assign a 1 or 0 value to each (x, y) coordinate’s increase value, depending on its position within the round.
newhex1 <- hex_points1(12)

newhex00 <- newhex1 %>%
  mutate(inc = ifelse(pos %% rnd == 0 & rnd > 1, 1, 0))

newhex00$rnd <- factor(newhex00$rnd)
newhex00$inc <- factor(newhex00$inc)
Adding to hexagon aesthetics
Now we can add to the scatterplot’s aesthetics to assign shapes based on round number, and color based on whether that point is an increase.
hexPalette <- c("#ff33cc", "#ff3300")
rndShapes0 <- c(19, 15, 17)
rndShapes <- rep(rndShapes0, 5)

ggplot(newhex00, aes(x = x, y = y, col = inc, shape = rnd)) +
  geom_point(size = 5) + scale_colour_manual(values=hexPalette) +
  scale_shape_manual(values=rndShapes) +
crochet_theme 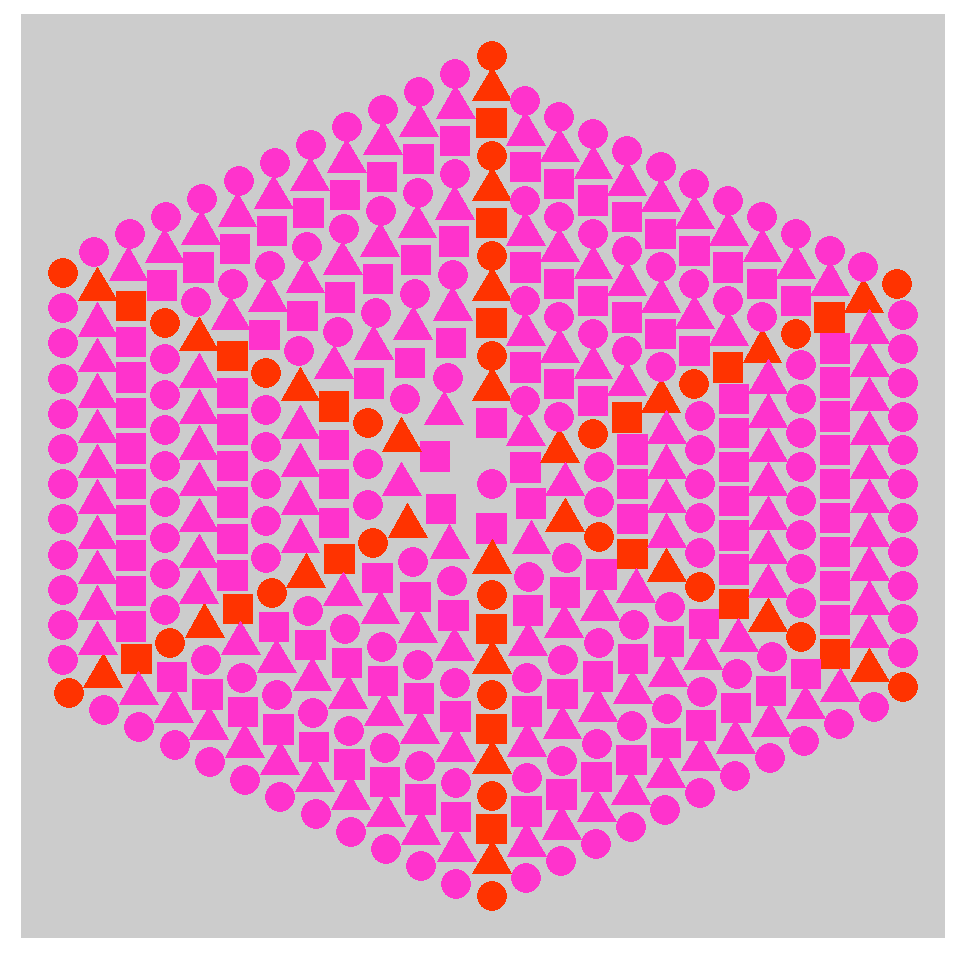
So now it’s easier to see the progression of rounds from the center on out by following the points that have the same shape. The shapes change just after the top point on each round. And we can see the points where the increases are taking place, which, to be clear, is the second of two single crochet stitches completed during an increase(), in the above crochet_circle function.
Wrapping this up
I enjoyed merging my love of crochet with my passion for coding. For now I must separate them again as I finish my latest yoga mat bag and move on to something else in R.